
First off, a great big “Thank You!” to the 16 people who chipped in with data for the little experiment I proposed in [Chaos and Form, Noise and Music: A Mini-Research Project->]! It was great fun to see all of your experiences and discussion rolling in, and to root for the data to go one way or the other. I really appreciate your participation!
Here is a graph of all the data I eventually received:
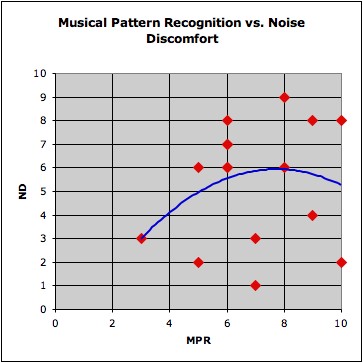
Based on this plot, I’m guessing that my theory doesn’t hold water. If it were true that a low tolerance for noise were the result of the pattern recognizing parts of your brain going into an overactive frenzy, I would have expected to see the trend to start low in the bottom left corner of the graph and to steadily rise toward the right side of the graph — obviously not what actually happens in reality.
But wait! This may just be a product of the small sample set. Look what happens if I remove a single outlying data point ([Barry Brake->], I’m looking at you):
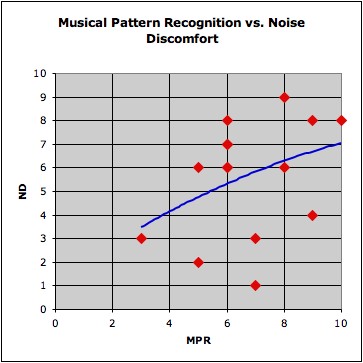
Suddenly, the curve becomes almost exactly what I would have predicted. So, I’m left with two possibilities:
- My theory is dead wrong.
- I need more people to answer my little quiz to get valid results.
Any of you statisticians out there care to weigh in? My theory may have life in it yet, but until I get more data, I guess I’ll have to consider this theory: